Understanding the Dashboard
Learn what each section of your company dashboard shows and how to use quick actions
Understanding the Dashboard
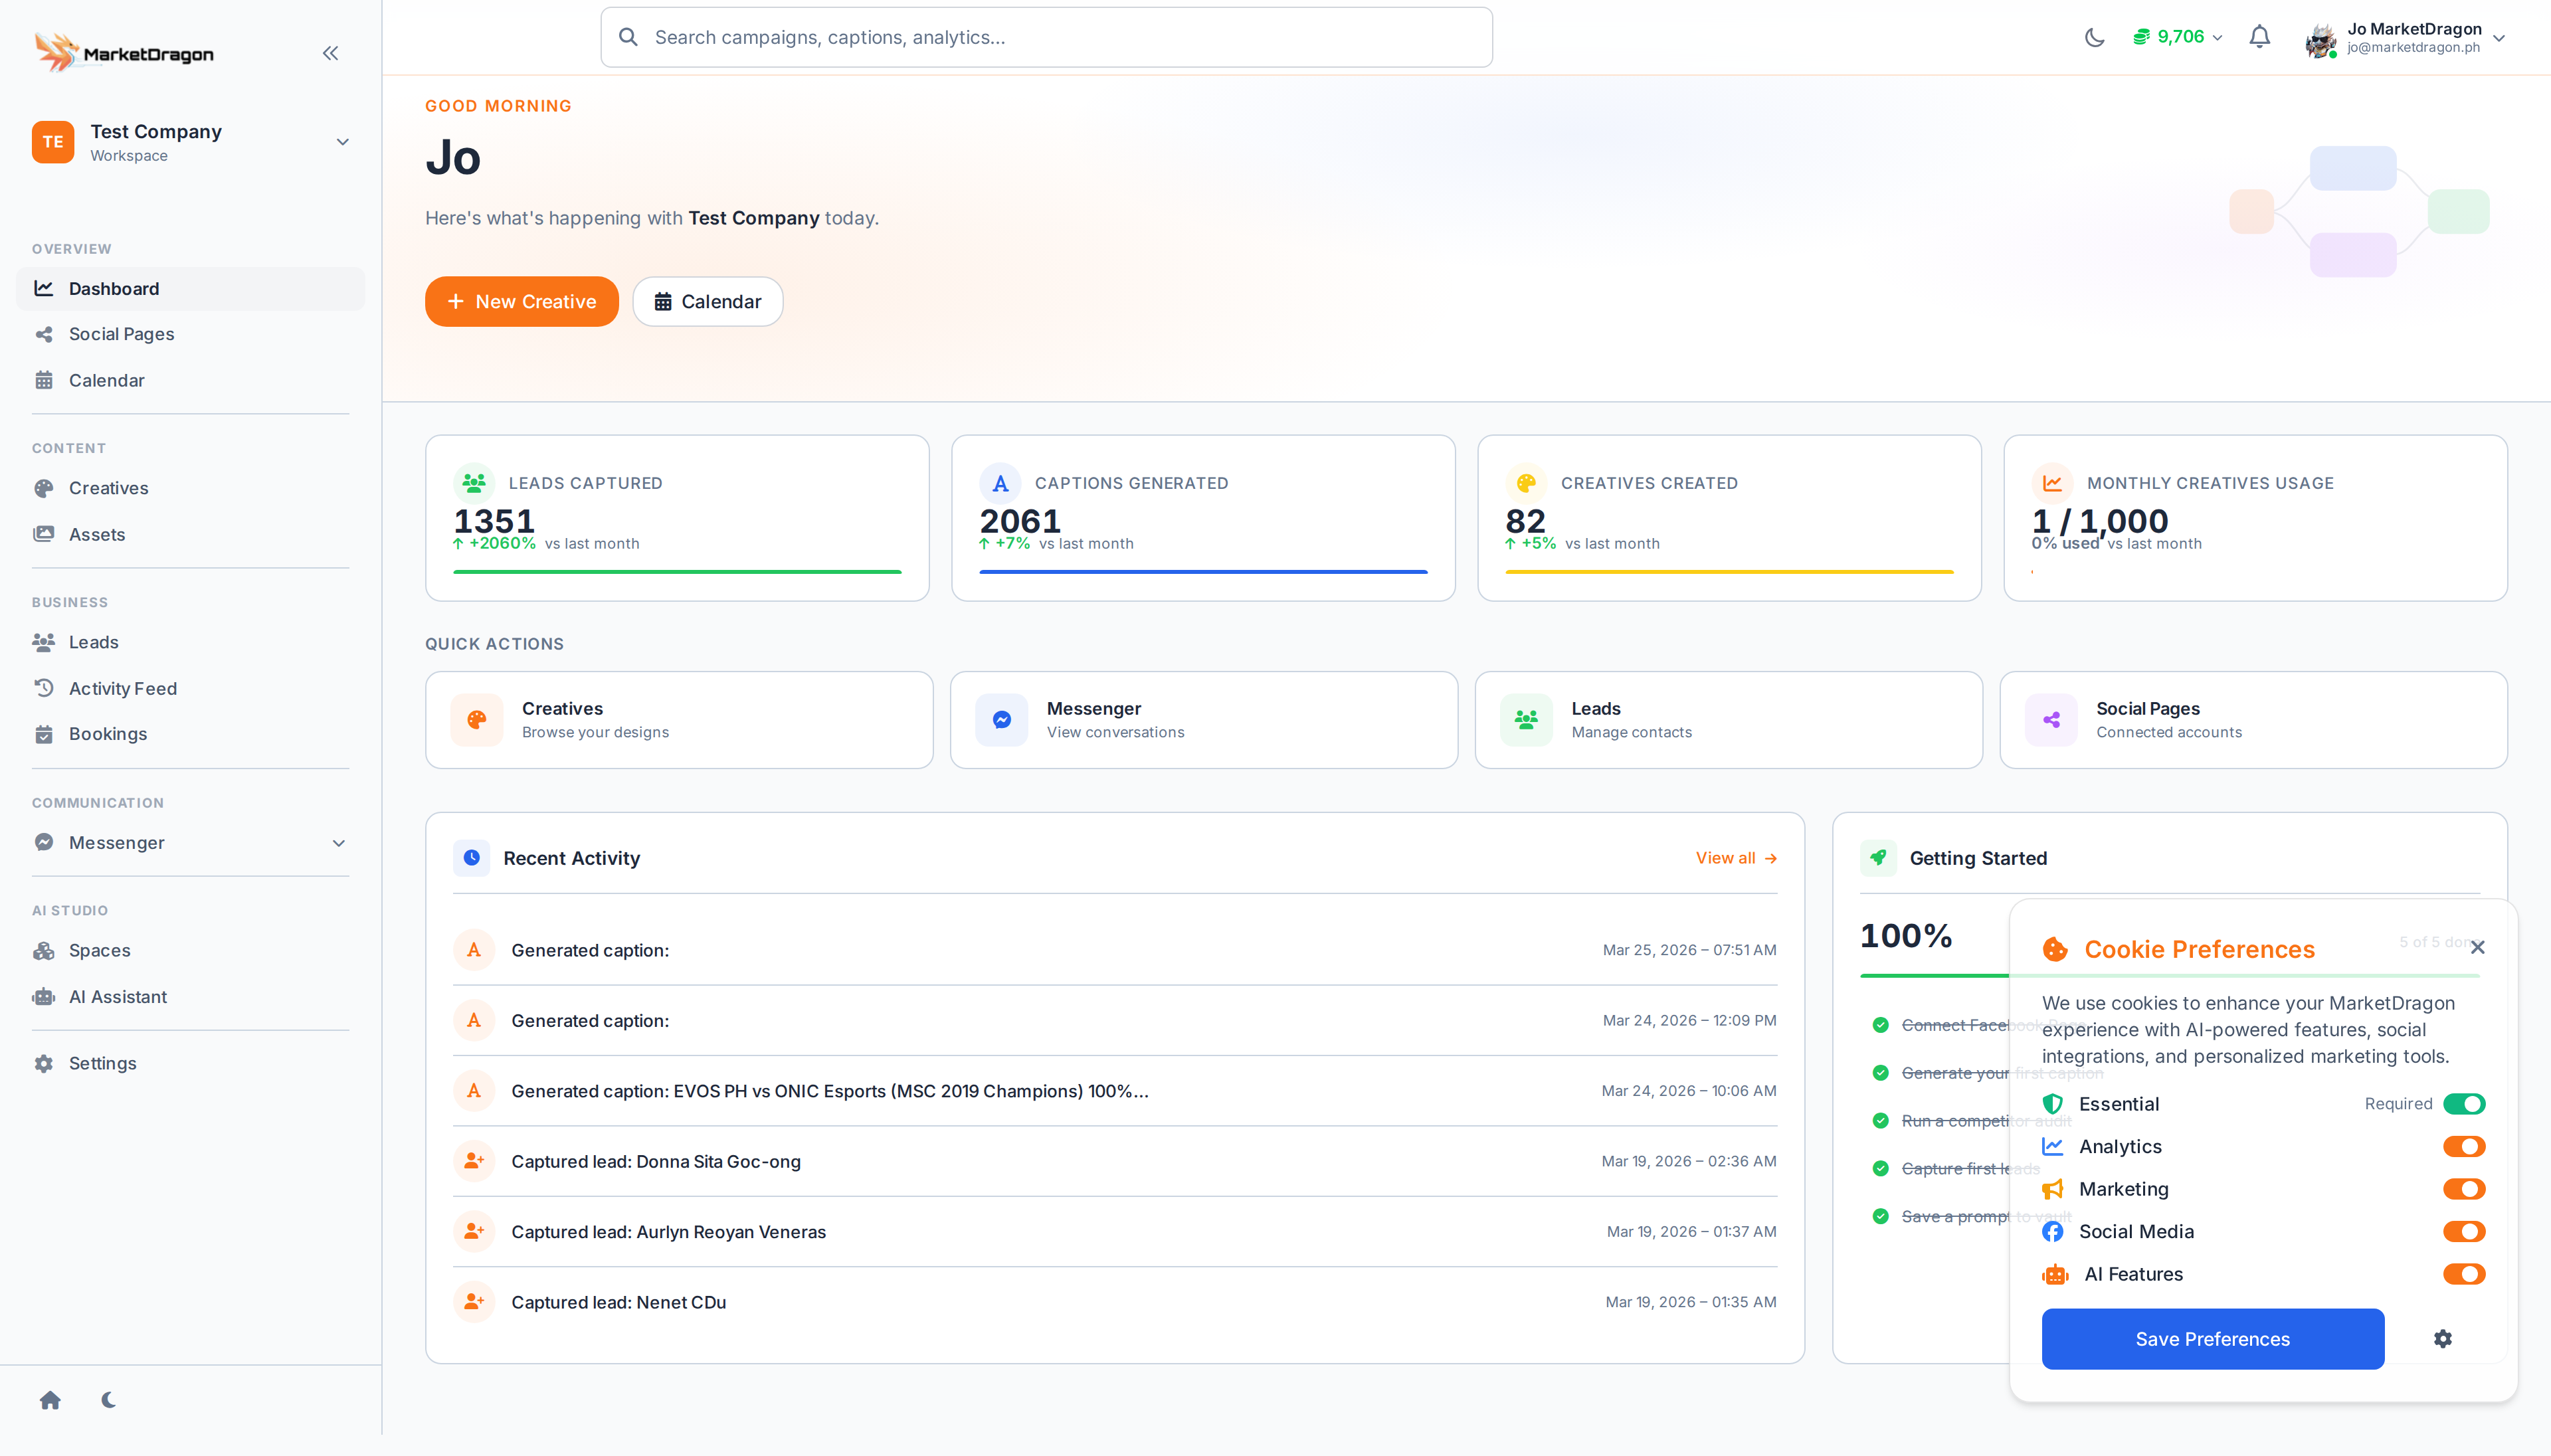
The Dashboard is the first screen you see after selecting a company. It gives you a real-time overview of your business activity.
Stats Overview
At the top of the Dashboard you will find summary cards showing key metrics:
- Leads -- Total leads and recent additions
- Posts -- Scheduled and published content count
- Conversations -- Unread messages waiting for response
- Sales -- Revenue and deal progress
Each card is clickable and takes you directly to the relevant section.
Recent Activity
Below the stats, the activity feed shows the latest events across your workspace -- new leads captured, posts published, messages received, and team actions. This keeps you informed without switching between pages.
Quick Actions
The Dashboard provides shortcut buttons for common tasks:
- Create Post -- Jump straight into content creation
- Add Lead -- Open the lead creation modal
- View Calendar -- Go to the Social Calendar
Using the Dashboard Effectively
- Check the Dashboard each morning to prioritize your day
- Use stat cards to spot trends (rising lead count, pending messages)
- Click directly into any metric to drill down
Next Steps
Video tutorial coming soon
A video walkthrough for this tutorial is being produced. Switch to Read mode for the full written guide.